Giỏ hàng hiện tại chưa có sản phẩm nào!

Mastering IELTS Writing Task 1: Comparing Two Pie Charts
Understanding how to effectively compare and contrast data presented in pie charts is a crucial skill for IELTS Writing Task 1. This article will guide you through the process of analyzing and writing a well-structured report on two pie charts, ensuring you achieve a high band score.
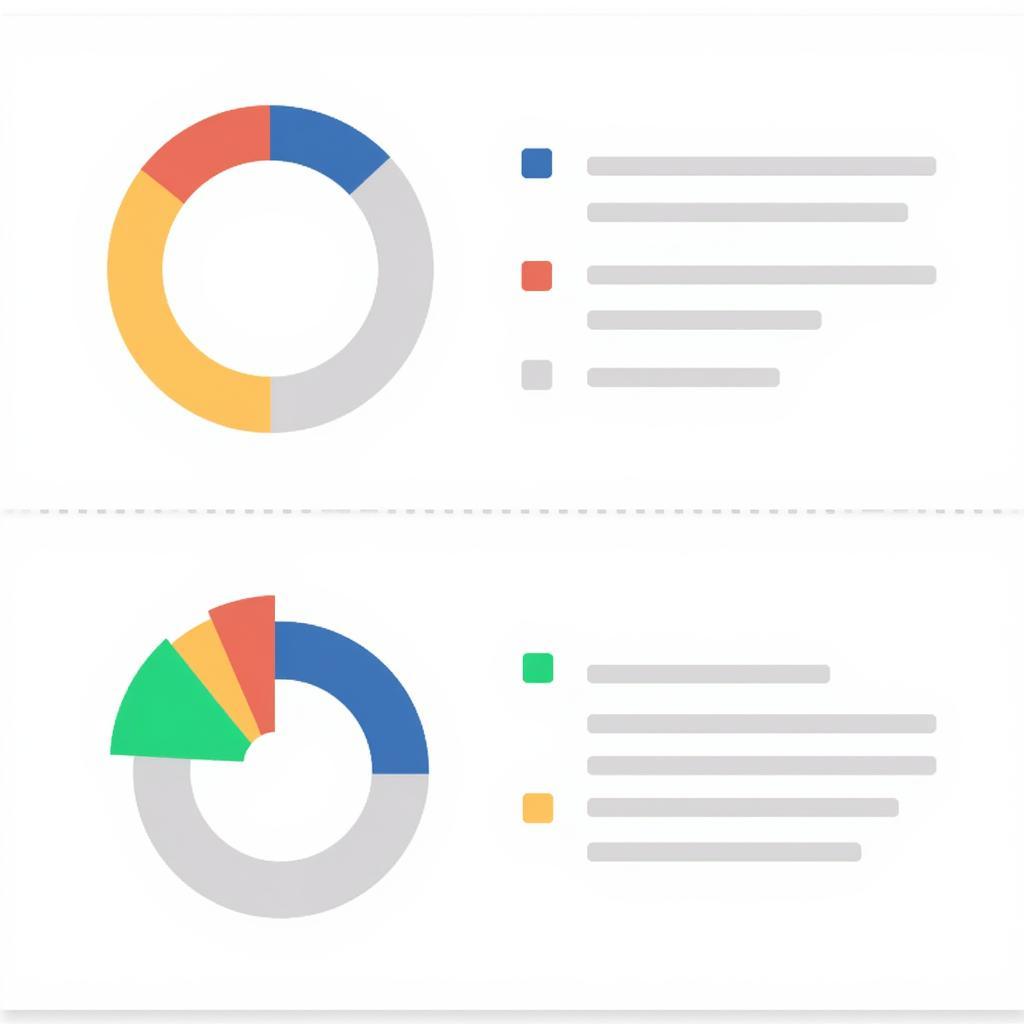
 IELTS Pie Chart Analysis
When presented with two pie charts, your primary objective is to identify and articulate the similarities and differences in the data they represent. Start by carefully examining the charts’ titles, labels, and legends to grasp the context and the type of information being conveyed.
Identifying Key Features and Trends
Before delving into the comparison, it’s vital to pinpoint the most significant features within each chart.
- Highest and Lowest Values: Determine the largest and smallest segments in each pie chart. These often represent the most dominant and least significant categories.
- Noticeable Differences: Observe any substantial variations in segment sizes between the two charts.
- Similarities: Identify any categories that share similar proportions in both pie charts.
Organizing Your Report
A well-organized report is essential for clarity and coherence. Follow this structure to ensure your analysis is easy to follow:
1. Introduction (Paraphrase the Task):
Begin by paraphrasing the information provided in the task. This demonstrates your ability to rephrase information using different vocabulary.
Example:
“The two pie charts illustrate the proportion of energy sources used in Australia and France in 2019.”
2. Overview (Highlight Key Differences and Similarities):
Provide a general overview of the main trends and differences between the two charts. This is where you summarize your findings from the initial analysis.
Example:
“Overall, it is evident that Australia relies heavily on coal for its energy production, while France shows a greater dependence on nuclear power. Both countries, however, share a similar reliance on renewable energy sources.”
3. Detailed Comparison (Support with Data):
This section requires a more in-depth analysis. Compare and contrast specific segments from each pie chart, supporting your observations with data. Use appropriate vocabulary to describe proportions, changes, and trends.
Example:
“Coal accounted for the largest share of energy production in Australia (60%), whereas in France, it constituted a mere 5%. Conversely, nuclear power emerged as the dominant source in France (70%), while it was entirely absent in the Australian energy mix.”
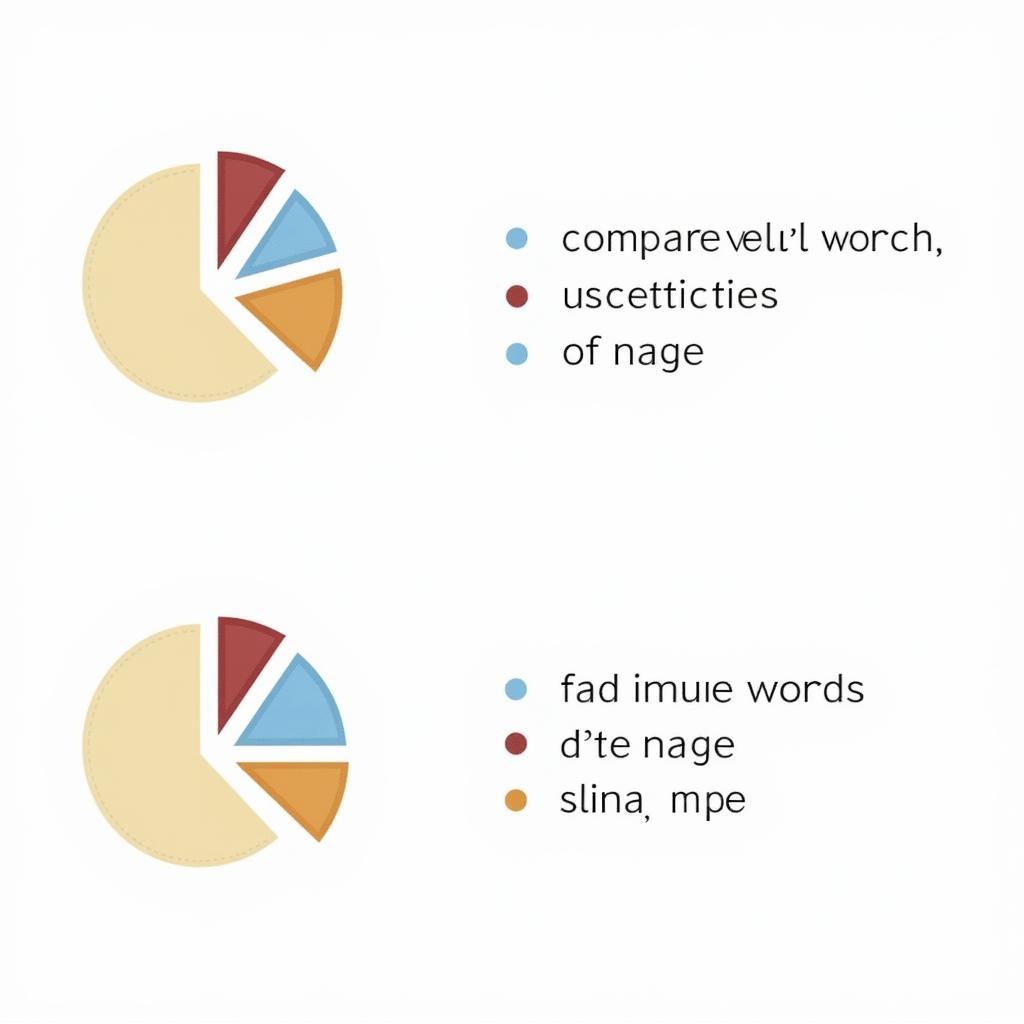
 Comparing Pie Charts in IELTS
4. Conclusion (Summarize Main Points):
Conclude your report by briefly summarizing the key similarities and differences you have identified.
Example:
“In conclusion, the energy consumption patterns of Australia and France reveal significant differences in their primary energy sources. While Australia heavily relies on coal, France demonstrates a strong preference for nuclear power.”
Language for Comparing Pie Charts
Employing precise language is crucial for accurately conveying your analysis. Here are some useful phrases:
- To show similarity:
- Similarly,…
- Likewise,…
- In the same way,…
- Both… and…
- To show difference:
- In contrast,…
- On the other hand,…
- Conversely,…
- While…
- To describe proportions:
- The largest proportion…
- The smallest share…
- …accounted for…
- …constituted…
Tips for Success
- Practice Regularly: Familiarize yourself with different types of pie charts and practice analyzing and writing reports on them.
- Manage Your Time: Allocate your time wisely during the exam to allow sufficient time for planning, writing, and proofreading.
- Proofread Carefully: Check for any grammatical errors, spelling mistakes, or inconsistencies in your writing.
By following these guidelines and practicing regularly, you’ll be well-equipped to tackle any IELTS Writing Task 1 question involving the comparison of two pie charts. Remember to focus on clarity, accuracy, and the effective use of language to achieve a high score.
FAQs:
1. What is the ideal length for the IELTS Writing Task 1 report?
Aim for at least 150 words. While there is no upper word limit, it’s best to be concise and focus on providing a clear and comprehensive analysis within a reasonable length.
2. Can I include my own opinions in Task 1?
No, Task 1 requires you to objectively describe and analyze the data presented. Avoid expressing personal opinions or making subjective judgments.
3. Is it necessary to use complex vocabulary?
While using a range of vocabulary is encouraged, prioritize clarity and accuracy. Don’t use complex words if you’re unsure of their meaning or usage.
4. What happens if I don’t finish Task 1 within the time limit?
It’s crucial to manage your time effectively. If you run out of time, try to provide at least a brief overview and some key comparisons.
5. How are IELTS Writing Task 1 responses scored?
Your response is assessed on four criteria: Task Achievement, Coherence and Cohesion, Lexical Resource, and Grammatical Range and Accuracy.
Need Further Assistance?
For personalized guidance and support in your IELTS preparation, contact us at 0372960696 or email us at tuyet.sixt@gmail.com. Visit our office at 260 Cầu Giấy, Hà Nội to connect with our expert team. We offer 24/7 customer support to address all your queries and concerns.